Drainage pattern in Auroville and its adjoining North and
Northwestern areas
Auroville is located at a higher altitude than
other areas is the Auroville bioregion. The Matrimandir is at a height
of 52 meters above the sea. The city area is located averagely at an
altitude of 45 - 52 meters. The eastern side (near the sea) of the
bioregion is at a minimum altitude. In the west and north western side
the height falls to minimum of 2 - 3mtrs. Anpakkam - the Estuary of the
flow is at a height of 2.4 meters.
In Auroville, the rainwater flows in all
direction, but maximum flow is towards the North -Northwest, East -
Southeast and East - Northeast. The area between Samasti and Fertile
windmill are 0% runoff areas.
Watershed
The slope and channels of a particular area define
the term "Watershed".
The North and Northwestern areas of the bioregion are the "Anpakkam
watershed". It is one of the sub watersheds of the Kaluvelly
watershed. Harvest has initiated a sub-watershed study last year and a
French student - Ms. Mallika PAULIK had given a preliminary report on
drainage pattern, nature of channels, slope etc.
Drainage map of the Anpakkam sub watershed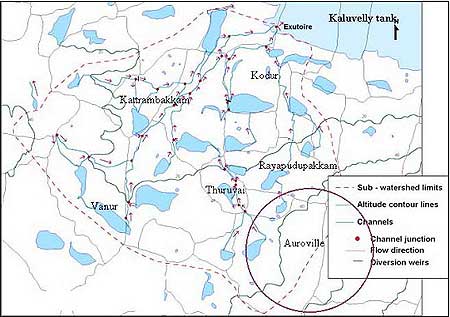
Some abstracts from our study are given hereunder
1. Total area of the watershed = 90 km²
2. Total Number of tanks = 22 (small to big)
3. The three major channels, which collect water for the Anpakkam
estuary are
a) Alankuppam - Rayapudhupakkam - Kodur - Anpakkam
b) Irumbai- Thuruvai - Kodur - Anpakkam
c) Vanur - Katrampakkam - Anpakkam
4. Total length of the above channel = 58 kilo meters
5. The slope of the channels = 0.27 %
6. The siltation of the channels = 56 % (lightly to heavily)
7. The Vegetative cover of the channels = 40 %
(for more info contact us @Harvest)
An Automatic Weather Station - A Central Weather Data point for the
Scientists, Farmers, Students and Others.
Introduction
Weather information plays a vital role in the field of Agriculture
and other related activities. Farmers, scientific persons, government
agencies etc obviously depend on weather information to plan their
activities. Hence, the data required should be precise and accurate at
the micro level for effective performance. Such data assists to
calculate the past trend and future forecast. It also helps the farmers
to decide on cropping, watering and harvesting periods.
The precise information thus collected helps in controlling the
exploitation of the Natural resources as well as in imparting it to
alternative technologies.
Automatic Weather Station
Auroville Water Service-Harvest has installed an Automatic Weather
Station in Vanur so as to find the micro level weather changes. This
station will benefit the villages located within 20 kms radius. The
parameters mentioned below will be stored and distributed to the
farmers, Government agencies, scientific persons and to others who
require the same.
1. Rainfall
2. Wind speed
3. Wind direction
4. Relative humidity
5. Solar radiation
6. Air Temperature
Proposed Location and importance
The above-mentioned Automatic Weather Station is to be installed in
the State Seeds Farm, Vanur. It has been felt that this place is viable
for easy access and has a possibility of using the existing
infrastructure for keeping the equipments safely. It is also believed
that the seed farm would be a permanent place for maintaining the
continuity of data storage system.
Method of operation
A 12-meter tower will be installed and the Automatic Weather Station
will be fitted on top of the tower. The signals will be carried through
high core cables to the data logger placed in the Storeroom. The data
logger will store the data obtained every 30 minutes. Meanwhile, we can
also program it to record the data per 1 minute or as required.
The data logger has a memory to store the data of minimum 15 days.
The values will be downloaded through memory module and processed with
the help of a computer.
It is proposed that the following data would be arrived from the
above said action
| Temperature |
Min |
Max |
Average (interval minimum upto 1 minute) |
|
Rainfall |
Min |
Max |
Total |
|
Humidity |
Min |
Max |
Average |
|
Wind direction |
Min |
Max |
Average |
|
Wind speed |
Min |
Max |
Average |
|
Solar radiation |
Min |
Max |
Total |
Benefits
1. Precise weather data will be provided to farmers living around the
villages within a radius of about 20 kms.
2. Government agencies, Education institutions, Non-Governmental
organizations and other scientific institution can also benefit from the
data.
3. The data will be stored in the archives and made available to the
people who are interested in knowing the trend and forecasting analyses.
4. It will also help us to do the water balance study and water level
comparison.
5. With the help of this data, reports can be published in the Media for
creating awareness among people about the importance of sustaining the
natural resources, especially water.
Note: To support this a network of 14 rain gauges has been
established ( see the previous blue pages)
|